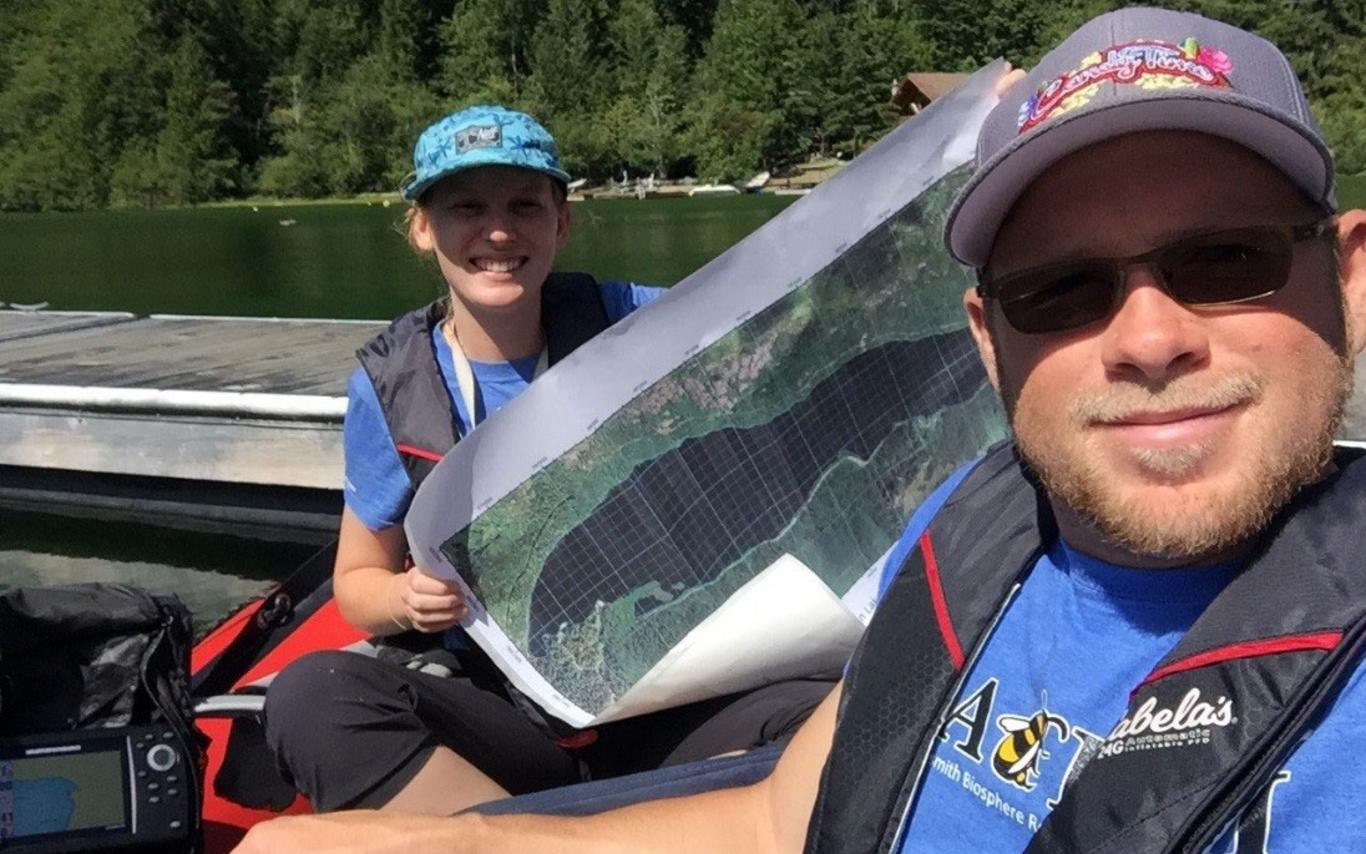
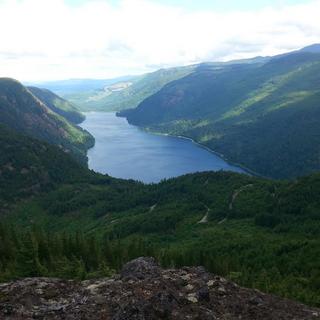
On the Tuesday after Canada Day, Ryan and I went to Cameron Lake (one of the MABR’s many Amazing Places) to work on a bathymetric map. Thanks to first-rate weather, views, and company it felt like an extension of the long weekend! But we were also collecting important data. Bathymetric maps display the depth and shape of submerged features; essentially they’re a topographic map of the lake floor. This information helps us understand limnologic ecosystem function and health. Bathymetric maps are also used to monitor sedimentation, create hydrodynamic models and nautical charts, and much more. The last bathymetric map of Cameron Lake was completed by the Department of Recreation and Conservation in 1951, so it’s about time for an update! Once we’ve completed this map and a historic aerial photo analysis we’ll send our results to Dr. Max Bothwell, an Emeritus Research Scientist at the Pacific Biological Station, so he can decide on the best locations to take core samples that will reveal the historic climate of the region.
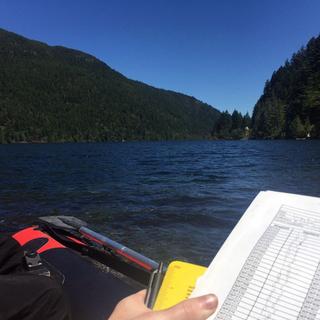
The day began at 8:00 am when I met Ryan at the lake to unload our equipment and get the boat in the water. For this data collection we would primarily be using a depth sounder, GPS device, and manual recording sheets. We packed everything into the boat, except for a fishing rod which unfortunately ended up in two pieces, crushing our dreams of catching some dinner at the end of the day. I’ve heard Cameron Lake is one of the few places in BC to catch brown trout, but we’ll have to go back another day to see for ourselves.
By 9:30 am it was starting to get hot and we were finally ready to get started, but the boat wouldn’t start! Ryan, the engine expert, struggled to figure out why our normally reliable motor refused to work while I ogled at the calm water, dreading the idea of heading back to the office without a single data point or freckle gained. Thankfully, once Ryan realized the gas line was connected backwards he was able to get the engine revving in no time. And we were off!
Our goal for the day was to complete a perimeter of the lake so we could determine the depths near the shoreline. Sounds like a simple task, but we encountered many obstacles in the form of fallen trees, rock shoals, and boat docks along the way. To get accurate results, we had to stay as close to the shore as possible so we needed to maneuver around each obstacle and collect data points on either side. Each data point consists of a waypoint taken on the GPS and a corresponding depth measurement from the sounder. The Ministry of Environment recommends taking one data point every second, but you can change the speed of your boat to collect more or less information about an area depending on the complexity of the lake floor. Cameron Lake has exceptionally clear water so we could usually see if the bottom was flat enough to move over it quickly, or if there were features that needed to be captured with several data points.
Circumnavigating the lake took us all day, but we completed our goal! We pulled in to the dock at 3:30 pm with over 450 data points. Over the next few weeks we’ll collect many more, because we still need to complete vertical and horizontal transects to determine the morphometry of the lake’s interior. Luckily Cameron Lake is pretty big so we’ll need to do multiple sessions before the summer is over. I can’t wait to get back out there soon. It was an excellent day working on an interesting and important project!


